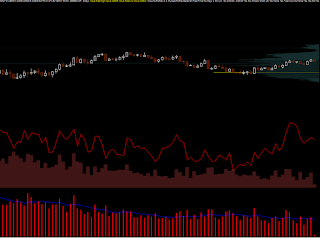
this is a new, quite simple but very useful study that i wrote a couple of days ago to measure the price velocity or "volatility" if you want.
probably most of you know ATR indicator which is commonly used by all who want to track the volatility or its changes. but the problem with ATR is, that it doesn´t really show much about how the price behaved.
it only calculates the difference of highs and lows of a bar and then divides this number by a preset variable to return an average. if you have a bar which has 10 ticks in size (high-low) than the true range is 10. very simple.
but it doesn´t tell much about HOW the price behaved within the period of the ten ticks. maybe it moved 9 ticks up, then nine 9 down, then again 9 ticked up, down, up, down, up, down.. you got the idea.. within just one bar.
so at the end of the day, the price could make 100 ticks long movement which is hidden within a single bar..
this study - which i called velocity - on the other hand, calculates how many times the price changed within a period time. so u get the precise number of the volatility. or we might say "nervosity" of price.
i did not have time to test it much but it looks promising mostly as an input to automatic trade-management for algorithmic trading..
here is a simple example (subgraph 2) - you can see that even though the candlesticks are of the same size all the time, the velocity studies gradually goes down
