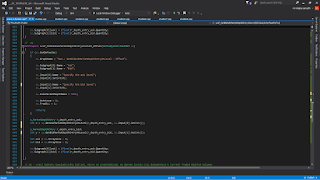
this is full code for getting POC (maximum volume) of a bar from a given timeframe. might be good to test the reaction of price to the previous day for instance..
#include "sierrachart.h"
#include <vector>
SCSFExport scsf_POC(SCStudyInterfaceRef sc)
{
if (sc.SetDefaults)
{
sc.GraphName = "Identifying POC Values";
sc.GraphRegion = 0;
sc.Subgraph[0].Name = "POC Value";
sc.Subgraph[1].Name = "POC Price";
sc.MaintainVolumeAtPriceData = 1;
sc.AutoLoop = 1;
sc.FreeDLL = 1;
return;
}
int poc_value = 0;
float poc_price = 0;
std::vector<int> v_poc_values = {};
std::vector<float> v_poc_prices = {};
const s_VolumeAtPriceV2 *p_volume_at_price = NULL;
int number_of_levels = sc.VolumeAtPriceForBars->GetSizeAtBarIndex(sc.Index);
for (int i = 0; i < number_of_levels; i++)
{
if (!sc.VolumeAtPriceForBars->GetVAPElementAtIndex(sc.Index, i, &p_volume_at_price))
break;
int last_volume_value = p_volume_at_price->Volume;
if (last_volume_value > poc_value)
{
poc_value = last_volume_value;
poc_price = p_volume_at_price->PriceInTicks * sc.TickSize;
v_poc_values.push_back(poc_value);
v_poc_prices.push_back(poc_price);
}
}
sc.Subgraph[0][sc.Index] = (float)poc_value;
sc.Subgraph[1][sc.Index] = (float)poc_price;
//log
SCString log_prices;
SCString log_values;
if (v_poc_prices.size() != v_poc_values.size())
return;
for (int i = 0; i < v_poc_prices.size(); i++)
{
log_prices.Format("%f", v_poc_prices.at(i));
log_values.Format("%d", v_poc_values.at(i));
}
sc.AddMessageToTradeServiceLog(log_prices, 0);
sc.AddMessageToTradeServiceLog(log_values, 1);
}
live intraday trading e-mini futures based on orderflow (tapereading), volume and intermarket analysis
8/23/2018
8/11/2018
ACSIL function for getting a market depth level value
simple, yet pretty useful function for getting values from particular levels at the depth of market
the good thing about this study is that you don't need to use historical market depth data on the chart, which makes it faster.
the line under the chart shows the (historical) value of bid and ask at the first level for each timestamp (here set to one second).
this can serve as a building block for creating a study for timing entry based on the quoting limit side. something i plan to do..
the good thing about this study is that you don't need to use historical market depth data on the chart, which makes it faster.
the line under the chart shows the (historical) value of bid and ask at the first level for each timestamp (here set to one second).
Subscribe to:
Comments (Atom)

