this is full code for getting POC (maximum volume) of a bar from a given timeframe. might be good to test the reaction of price to the previous day for instance..
#include "sierrachart.h"
#include <vector>
SCSFExport scsf_POC(SCStudyInterfaceRef sc)
{
if (sc.SetDefaults)
{
sc.GraphName = "Identifying POC Values";
sc.GraphRegion = 0;
sc.Subgraph[0].Name = "POC Value";
sc.Subgraph[1].Name = "POC Price";
sc.MaintainVolumeAtPriceData = 1;
sc.AutoLoop = 1;
sc.FreeDLL = 1;
return;
}
int poc_value = 0;
float poc_price = 0;
std::vector<int> v_poc_values = {};
std::vector<float> v_poc_prices = {};
const s_VolumeAtPriceV2 *p_volume_at_price = NULL;
int number_of_levels = sc.VolumeAtPriceForBars->GetSizeAtBarIndex(sc.Index);
for (int i = 0; i < number_of_levels; i++)
{
if (!sc.VolumeAtPriceForBars->GetVAPElementAtIndex(sc.Index, i, &p_volume_at_price))
break;
int last_volume_value = p_volume_at_price->Volume;
if (last_volume_value > poc_value)
{
poc_value = last_volume_value;
poc_price = p_volume_at_price->PriceInTicks * sc.TickSize;
v_poc_values.push_back(poc_value);
v_poc_prices.push_back(poc_price);
}
}
sc.Subgraph[0][sc.Index] = (float)poc_value;
sc.Subgraph[1][sc.Index] = (float)poc_price;
//log
SCString log_prices;
SCString log_values;
if (v_poc_prices.size() != v_poc_values.size())
return;
for (int i = 0; i < v_poc_prices.size(); i++)
{
log_prices.Format("%f", v_poc_prices.at(i));
log_values.Format("%d", v_poc_values.at(i));
}
sc.AddMessageToTradeServiceLog(log_prices, 0);
sc.AddMessageToTradeServiceLog(log_values, 1);
}
Showing posts with label footprints. Show all posts
Showing posts with label footprints. Show all posts

5/17/2018
nq long
this was probably the best entry in this week. the boogie-woogie studies under the main chart are my acsil based subgraphs. they are amazingly strange so far, like spoiled kids, not doing what they are supposed to do ..
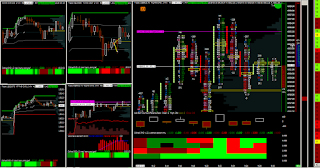


ex-it

pretty freaking sweet..
+ 450 usd/one trade
2/02/2018
it looks amazing..
yeah. the markets were falling today, the volatility was doubled compared to a normal state so that the risk and reward had to be doubled too and the opened position had to be halved.
currently, i trade smaller positions, so i opened only two contracts right here
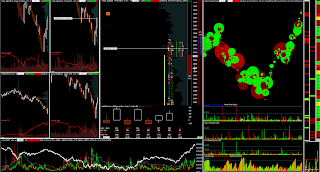
the timing entry of this trade later in the afternoon was based on the tick-nyse indicator. the first part of the position was closed in the profit, the other part (which i meant to close quite far) ended up at stoploss.

it looks amazing, doesn´t it?
currently, i trade smaller positions, so i opened only two contracts right here

the timing entry of this trade later in the afternoon was based on the tick-nyse indicator. the first part of the position was closed in the profit, the other part (which i meant to close quite far) ended up at stoploss.

it looks amazing, doesn´t it?
1/23/2018
come on man, this is going to rise!
well, these two trades are quite readable i would say, and the price went up really quickly after i clicked into them..
the timing entry at the first one is not really easy but .. what is easy in daytrading after all? we can see a sharp & emotional move downwards from the highest high.
the word "emotional" is really what makes it important because i trade against the emotional people so i really enjoy seeing something like this.
it was validated with the actual non-correlation of the markets. the entry was planed couple of minutes before it actually took place. here is the hit.

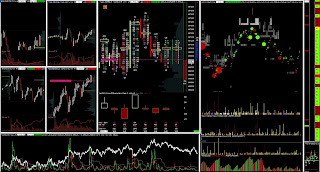
the timing entry at the first one is not really easy but .. what is easy in daytrading after all? we can see a sharp & emotional move downwards from the highest high.
the word "emotional" is really what makes it important because i trade against the emotional people so i really enjoy seeing something like this.
it was validated with the actual non-correlation of the markets. the entry was planed couple of minutes before it actually took place. here is the hit.

the other one was right here, after nq discovered new high and tempted high sellers to jump in. as always, i go against them, because they are too predictable.

1/20/2018
nasdaq 100 futures filled with huge sell market orders
on friday there was a big selling subject on e-mini nasdaq 100 which is clearly visible from the attached chart.

thus, both their risk and their reward tend to much further from what i use in my intraday trading and it is not always clever to track it
that is why i can without any problems take a long and go against the big selling subject because the rotation i speculate on, is - compared to their risk/reward - really small.
this was one trade with a clear timing entry base on exhaustion of (retail) sellers.

1/18/2018
3 trades, 3 contracts, 3 profits
here is the screenshot showing the closed trades.

many people when they this screenshot or another screenshot with my trades have the idea that it was a mistake that i closed the trades so early.
sometimes people really wonder and ask me, why i don't hold on the trades longer, for a longer profits.
the answer?
i am an intraday trader, not a god.
i don't know if the price will move further or retreats back. i am not a prophet. and i don't try to be.
closing trades in a fixed trade management is the best thing you - as a trader - can do.
because by closing them properly, you are not playing russian roulette. you are not positioning yourself in the place of "a prophet". you are simply doing your job correctly.
here is the results. 3 (little) trades, with only 3 contracts. 3 profits. + 730 usd netto.

1/17/2018
crawly lazy price
today´s e-mini markets were crawly, lazy and boring. the session started with a good tempo but quickly became really slow and tedious. the candlesticks were overlapping one another which is always a sign of an untradable market.
within the first hour, i haven´t seen any opportunity for opening a trade. i stayed a little bit longer and took this short on e-mini dow
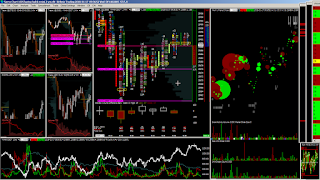
this is the kind of entry that is more speculative and riskier. at first, i opened only three contracts and compensated to the full position a little bit higher.
anyway, only one part of the position (4 contracts out of 6) filled the target, the other half ended up at stop loss.
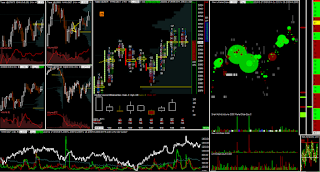 +100 usd today is a poor result for such a long time.
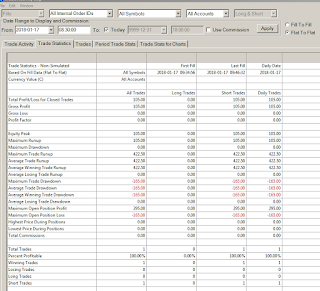
within the first hour, i haven´t seen any opportunity for opening a trade. i stayed a little bit longer and took this short on e-mini dow

anyway, only one part of the position (4 contracts out of 6) filled the target, the other half ended up at stop loss.


4/28/2017
big subject activity on daily low - scalping algo breakout
this is what i have noticed today on daily low at e-mini nasdaq 100 futures somewhere around 13:10 chicago time


the interpretation of this visualization is this: near daily low a big rough market and a big sell market order of the same quantity appeared. it was immediately identified by an algorithm which started selling using sell markets in a "clever" manner.
at the same time, sell markets were supported with huge sell limit (on the depth of market as the white line). when no one wanted to buy this big amount and fill the huge sell limit, the subject starts selling in a harsh manner - using big sell market orders. the price drops a little bit down and the subject closes the position in a "clever" way using smart activity. taking profit.
the price made a small pullback up and the algorithm started selling again, using a high amount of sell market orders in a matter of (mili)seconds. at the same time, big sell limit appeared at the depth of market, was filled this time with a big buy market order and the price slides lower. the selling subject closed the position in a smart way, taking profit again.
again, it started opening bigger sell markets now to break the daily low. its big sell limits were strong enough to eat all the offered liquidity in the dept of market.
at the break of the daily low a 100-contracts big buy market order tried to protect the zone, but was neutralized with a 100-contracts sell limit. moreover, the 100 sell limit was supported with an even bigger sell limit (the size cca 230) accompanied with sell market in the size 120! it hit the daily low, closing the position in a clever way, taking its profit (yes again!) and reversing the position for long.
this is how a very powerful and very clever scalping algorithms operate..
this is where it happened in the chart (daily low - sensitive area)

this is how the footprint charts of the area looks like

4/08/2017
dow jones sell off speculation on friday night
yesterday i took these two trades on dow jones futures. the first short after open was taken with 6 contracts, the second one with two only. the first trade had a runner with was planned to be closed somewhere near the low of the day,
unfortunately, the market filled my trailing stop precisely and dropped significantly afterward.
 what was interesting at the second trade was waiting liquidity of the huge buy limit orders at the closing time.
here is the prinscreen, the white line on depth of market shows huge limit orders waiting to be filled. at first the price rebounds couple of time from this level.


unfortunately, the market filled my trailing stop precisely and dropped significantly afterward.

here is the prinscreen, the white line on depth of market shows huge limit orders waiting to be filled. at first the price rebounds couple of time from this level.

at the end it went through filling all the waiting limits (cca 230 on one level). as these limits were filled, i closed the trade, because i expected the price to move higher. anyway, it didn´t. the market closed somewhere around near this level.
here is how the footprint chart looks at that particular place. you can see higher ammoung of sell market order paired up withthe waiting buy limit side (te low of the bar at 14:58)
 here is the slower timeframe (30 min). the trade looks good, pity it was with a small position only
here is how the footprint chart looks at that particular place. you can see higher ammoung of sell market order paired up withthe waiting buy limit side (te low of the bar at 14:58)


result +720 usd

1/13/2017
wem´s last public entry
against late buyers in undervalued nasdaq futures
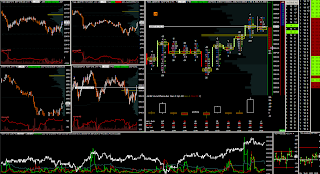


exit after seller´s eruption

1/09/2017
dow jones futures short (after trapped late buyers)
these days after american lunch the volatility drops significantly and the markets are literally dead. trading in such environment takes lot of discipline when t comes to waiting for an opportunity. there are not many opportunities these days, so whenever one appears, one need to catch it quickly, automatically.
this was the only tradeable situation today. ym futures tried to break the swing high but the buyers were absorbed. the entry moment is here:
 here is the support at market orders that show diminishing power of buy market side - this would be a better moment for the entry

a nice "second entry" in the area of my "first entry"
 wmo shows no interest at buy market side and it is flat - good for "second entry"


this was the only tradeable situation today. ym futures tried to break the swing high but the buyers were absorbed. the entry moment is here:


although i planned the second target further, i closed it prematurely because i did not have any profit today and the market were terribly slow and tiring today (and about to close in a while)

12/18/2016
nq long
a second entry with timing based on the extinction of sellers. the potencial was nice

closed safely before a possible breakout

2/02/2016
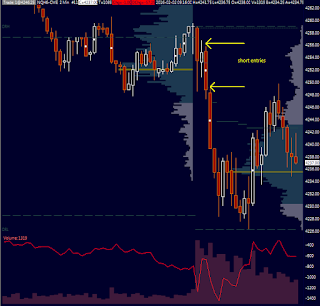
huge selling sentiment on the market´s open
today nq opened with quite a strong selling sentiment. i was putting sell limit orders immediatelly after recognizing a known orderflow pattern. yet, again, no fill

the market ran down and here was another possible short entry based on times and sales. this one is more risky..
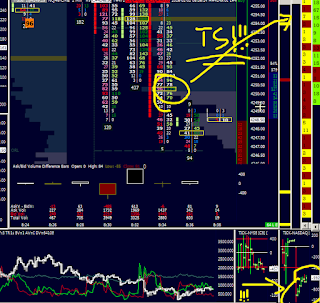
but.. it fell down pretty fast and to catch this kind of a selloff is almost a superhuman task


Subscribe to:
Posts (Atom)