2/22/2018

hmm.. bad luck

as i said yesterday, today i planned to trade with a bigger possition of 6 contracts but was little bit unlucky, because i did not get the fill of all the 6

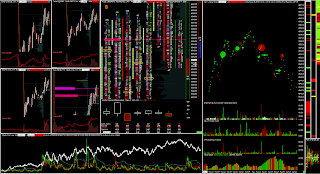
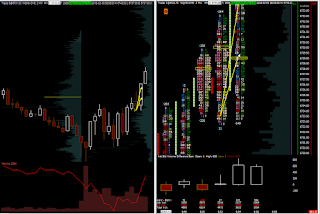
here i was clicking to take short, on a nice orderflow exhaustion of buyers. it was quite clear that the price does not have enough power to move so i was not hesitating..

intraday trading nasdaq futures 100

but the price slid down really quickly and filled only 2 contracts out of 6.

first contract was closed on target within a couple of seconds to make risk free trade as usual, the other one let little bit further on a volatile target.

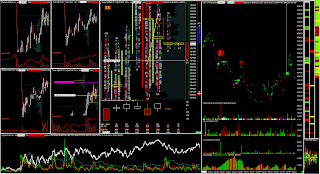
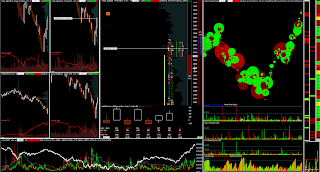
intraday trading nasdaq futures 100

it was quite a nice catch of the local high with absolutely precise timing entry and virtually no drawdown
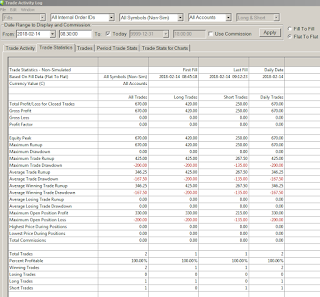
sierra chart trade log

feelling really unlucky for not being filled with all the 6. it could have been a nice profit

2/21/2018

just one short

this was the only entry i did today, probably the last time with small position of two contracts only. 


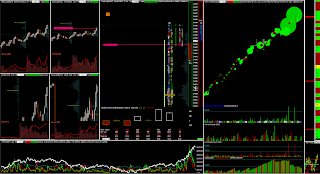
intraday trading orderflow footpirnt chart

from tomorrow i will start with 6 again because with 2 it is like a demo version

2/20/2018

today..

nq was in a good setup for buying.

at first i tried with two contracts i but i hit only one target and the second one ended up on stoploss - very precise.. after i was stopped out, the price went up.

the second trade was a mistake, i was able to open only 1 contract so i closed it on be. 

the last trade was a good one. long after the sellers' exhaustion. a good timing entry.. 

sierra chart - intraday trading
result 500 usd

sierra chart - trade log

and yeah, it still moves up. today it was quite observable that nq will rise.

nasdaq 100 futures intraday chart

also on depth of market we could see bigger quotting limits on sell side being eaten by agressive market orders. this is a good environment for a bigger player to buy without slips

2/17/2018

later in the evening

on friday, later in the evening, there was this situation that offered a good short setup for nq nasdaq. this is 30 minutes timeframe that i use for a long term planing if necessary.

intraday orderflow trading - sierra chart

from all the four markets, only nasdaq broke the daily low, the other three did not. it creates a pressure buying, because nasdaq looks to be cheaper and dis-correlated.

i was waiting for an orderflow timing to jump into short trade and speculate against these buyers who were trapped. this is the closed trade

intraday orderflow trading - sierra chart

this was the second trade on friday. the first trade was a loss at 9:00 - i did not notice there was a report at 9:00 and took long one minute before it.

as soon as i opened the long position, the price dropped, so i had closed 200 usd loss. it was one of the quickest loss ever.

my mistake to open the trade right before the announcement report.

daily result is here.
sierra chart trade log

2/14/2018

still volatile, but readable

the volatility in us indexes is still high but the market seemed a little bit more readable today. there was an intermarket scheme that i know as a good setup for long entry.

it happened in nasdaq some 15 minutes after open. i took a long trade right here. as you can see, i went into a little drawdown, because the volatility is still very high, i am not able to catch the reversal very precisely

intraday trading orderflow - sierra chart

i am opening only two contracts to eliminate the risk. i hit both the targets. the first one was closed here, making it a risk-free trade, the other was after the breaking of the daily high.

intraday trading orderflow - sierra chart

the second trade today was dow jones short after an orderflow gradation with confirmation of low heat entry.
intraday trading orderflow - sierra chart

both of the targets were closed at the level of fist one. i had a feeling that today the price will go up so taking shorts was not the most comfortable.
sierra chart trade log


the result is 650 today is enought, i did not want expose to it any longer


2/11/2018

depth of market liquidity disappeared..

last week the indexes went into extreme volatility and i did not trade much and if so, it was kind of a testing mode..

this environment is dangerous for order flow trading because the limit side is really shaky.

when you see dom liquidity like this, you immediately have to know there is something wrong with the market.

depth of market - sierra chart

this is something people who don´t see the market depth never realize - the change of the quoting limits.

trading in this environment is extremely dangerous, the laws that normally works and that i use for trading, does not work in this environment.

it is basically caused by market makers who are no longer interested in opening trades and thus, the short-term price action is much more unpredictable

2/05/2018

why i trade intraday

this is the reason why i trade within intraday timeframe and don´t invest long term

orderflow intraday trading - sierra chart

i can hardly remember when i saw something similar and i would NOT like be a long-term buy-and-hold investor these days. 

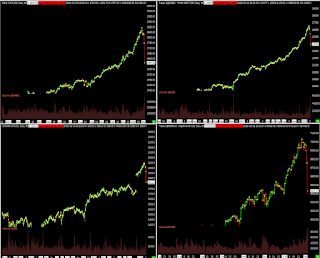
in the markets, there applies a simple formula: the longer the timeframe, the lower the probability of guessing the correct direction

no, i don´t believe in long-term investing. it is a fake idea. all these investing gurus, buffet, hedge funds managers etc.. no one knows what is going to happen on the markets within one hour, how can they say what will happen within a week, month or a year?

short-term investing makes sense to me much more.

i am able to say what is going to happen in my life within one minute from now. much less i can say what is going to happen within one day from now, even less within one week and i have an idea what is going to happen with a year or more..

in the same way it is in the markets. i can quite accurately say what is going to happen with the price within a couple of seconds or minutes. that is all i need to do day trading.

for example today, i took one trade that lasted a couple of minutes. and by the way, it was a long trade! hah.
orderflow intraday trading - sierra chart

this was quite an easily readable long entry, due to increase volatility i took only 2 contracts. +330 usd was the result within a couple of minutes. stress-free trading
2/02/2018

it looks amazing..

yeah. the markets were falling today, the volatility was doubled compared to a normal state so that the risk and reward had to be doubled too and the opened position had to be halved.

currently, i trade smaller positions, so i opened only two contracts right here

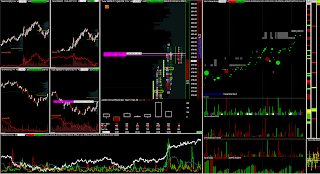
e-mini futures trading - sierra chart

the timing entry of this trade later in the afternoon was based on the tick-nyse indicator. the first part of the position was closed in the profit, the other part (which i meant to close quite far) ended up at stoploss.
e-mini futures trading orderflow - sierra chart

it looks amazing, doesn´t it?