when it comes to acsil programming, sometimes you can get stuck in one place for a long time just because a simple tiny detail that you cannot solve out.
for me it was problems connected with setting up the size of arrays in overlaid charts. in sierra chart´s acsil libraries there are couple of functions for addressing the values of a different chart, but now matter which way i tried, it never worked out well.
i was able to transfer the data from other charts into my primary chart, but the values at a particular index were incorrect.
the reason was that the number of indexes in the arrays from other charts was not the same as the number of indexes in the primary one.
it sounds simple, and sierra chart support describes it in their documentation, but because i am a complete computer idiot, i was unable to get it done.
now i have finally fixed it so here i will give a couple of tips on how to do it.
first of all, a brief introduction.
why do we need to get the values of another chart, anyway?
simple example.
lets say u have found a trend pattern, but you want to open a trade only when tick nyse is above zero. for this, you need to get THE CORRECT value of tick nyse at the time (meaning at the current index) of the planned entry.
if tick nyse at the current index will be below zero, you will filter out the signal and no position will be opened, if it will be above, you will open. easy enough.
the problem is that the tick nyse starts at 8:30 and ends at 15:00
us indexes (YM, NQ, ES..) starts at 8:30 and ends at 15:15
thus it is obvious the number of indexes (the number of candlesticks) is different. and that is a big problem. if you wanna transfer the arrays (for example highs and lows) of tick nyse into the es chart and get the values for a particular candlestick at es, the values will be incorrect.
how to solve it?
easily
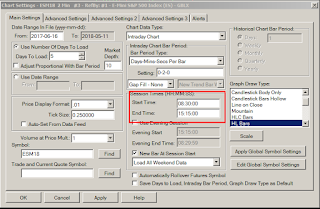
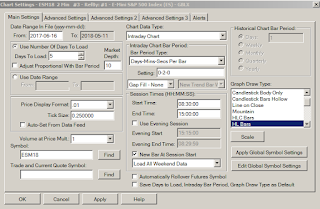
the first thing you should do in such a case is to re-set up the trading hours. normally i have trading hours in my charts like this because US indexes end at 15:15
you have to set the trading hours according to the chart that has less number of candlesticks (in this case it is tick nyse). so it should finish at 15:00
after that, it is important to set the linking with all the other charts (if u have any) so that you are sure the number of indexes will be the same for each array of each chart.
this is super important if you work with more charts that just two (just like me) and want to address the values of their arrays for computing correlations (just like me)
so this is the basic setting for working with an array of any other chart in the same chartbook. this should be used as defaults, otherwise, the values will never be correct.
after that, you have to choose which way to address the values of other charts.
i use acsil´s graphdata object which is implemented in sierra chart and works pretty fine, but there are a couple of other ways to do it (for example using overlay study and addressing the values of the overlaid chart as a subgraph).
anyhow, the code for getting high, low, close arrays from three different charts can look like this:
this is i would say the kernel for whatever you need when it comes to getting correct values from a particular chart. the code is pretty easy and simple, and the values that you get can be used in the same way as the values of the primary chart (eg. sc.low[sc.index], sc.high[sc.index] etc..)
pretty straightforward..
