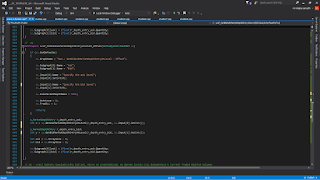
this is full code for getting POC (maximum volume) of a bar from a given timeframe. might be good to test the reaction of price to the previous day for instance..
#include "sierrachart.h"
#include <vector>
SCSFExport scsf_POC(SCStudyInterfaceRef sc)
{
if (sc.SetDefaults)
{
sc.GraphName = "Identifying POC Values";
sc.GraphRegion = 0;
sc.Subgraph[0].Name = "POC Value";
sc.Subgraph[1].Name = "POC Price";
sc.MaintainVolumeAtPriceData = 1;
sc.AutoLoop = 1;
sc.FreeDLL = 1;
return;
}
int poc_value = 0;
float poc_price = 0;
std::vector<int> v_poc_values = {};
std::vector<float> v_poc_prices = {};
const s_VolumeAtPriceV2 *p_volume_at_price = NULL;
int number_of_levels = sc.VolumeAtPriceForBars->GetSizeAtBarIndex(sc.Index);
for (int i = 0; i < number_of_levels; i++)
{
if (!sc.VolumeAtPriceForBars->GetVAPElementAtIndex(sc.Index, i, &p_volume_at_price))
break;
int last_volume_value = p_volume_at_price->Volume;
if (last_volume_value > poc_value)
{
poc_value = last_volume_value;
poc_price = p_volume_at_price->PriceInTicks * sc.TickSize;
v_poc_values.push_back(poc_value);
v_poc_prices.push_back(poc_price);
}
}
sc.Subgraph[0][sc.Index] = (float)poc_value;
sc.Subgraph[1][sc.Index] = (float)poc_price;
//log
SCString log_prices;
SCString log_values;
if (v_poc_prices.size() != v_poc_values.size())
return;
for (int i = 0; i < v_poc_prices.size(); i++)
{
log_prices.Format("%f", v_poc_prices.at(i));
log_values.Format("%d", v_poc_values.at(i));
}
sc.AddMessageToTradeServiceLog(log_prices, 0);
sc.AddMessageToTradeServiceLog(log_values, 1);
}

8/11/2018
ACSIL function for getting a market depth level value
simple, yet pretty useful function for getting values from particular levels at the depth of market

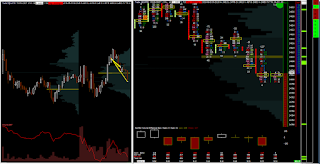
the good thing about this study is that you don't need to use historical market depth data on the chart, which makes it faster.
the line under the chart shows the (historical) value of bid and ask at the first level for each timestamp (here set to one second).

this can serve as a building block for creating a study for timing entry based on the quoting limit side. something i plan to do..

the good thing about this study is that you don't need to use historical market depth data on the chart, which makes it faster.
the line under the chart shows the (historical) value of bid and ask at the first level for each timestamp (here set to one second).
6/28/2018
numbers that matters
there is a holy grail hidden in these numbers
number of trades bid vs number of trades ask vs bid volume vs ask volume etc..

this is what i am currently algo testing on sp500, dow, nasdaq, rty, crudeoil, heating oil, gold, silver, copper, 6a, 6b, 6c, and all other bunch of future markets
simple, easy, clean and fast
number of trades bid vs number of trades ask vs bid volume vs ask volume etc..

this is what i am currently algo testing on sp500, dow, nasdaq, rty, crudeoil, heating oil, gold, silver, copper, 6a, 6b, 6c, and all other bunch of future markets
simple, easy, clean and fast
6/05/2018
ym should fall down
today the open was really weak with low volatiltiy and tedious price action. i had to wait 1/2 hour for the first trade that i took right here.

form the dislocation of the markets i can assume that ym should move down, the orderflow is not the best but is quite allright. opening 4 contracts.
it took a little drawdown but the price slided as expected..
here i have 3 contracts from 4 cloesd and the trade is risk free
 .
.

form the dislocation of the markets i can assume that ym should move down, the orderflow is not the best but is quite allright. opening 4 contracts.
it took a little drawdown but the price slided as expected..
here i have 3 contracts from 4 cloesd and the trade is risk free

the final contract is closed after the seller´s emotion

it was the one and only trade becaus the price action was really slow.
+300 usd.


finito. no need to waste time with such markets
6/03/2018
super-bad backtest results from a super simple acsil code
i have been doing some acsil coding sierra chart lately and built up a couple of new setups.
sometimes it is quite time-consuming and difficult to build a good strategy that returns nice results.
of course, backtest are not the only thing to weight and worry about, but it is definitely the first thing u see.
the worst backtests are not the one that had poor results but the ones where the profit factor is somewhere around 1,00. it means that the profits and losses are equal.
some might think that the worst backtests are simply the ones with the worsts result, but no, that is not necessarily true. at least not for me..
because when i find a strategy that is really poor and loses 9 times out of 10 entries, i can simply change the direction for each entry and... voila, i got a pretty good scoring one.
today i run a backtest that returned really horrible results. i mean, i have never run a test that would be as bad as this one.
it has 0.23 profit factor which means that from each 5 entries, 4 of them go to sl..
i tested only 40 days, but the number of trades is 505 which is quite high.. so yeah, it might say something..
 next step?
reverse the position and run it on a longer frame..
maybe, this piece of crap will become one of the most profitable strategies in the entire freaking universe :-)
who knows..
sometimes it is quite time-consuming and difficult to build a good strategy that returns nice results.
of course, backtest are not the only thing to weight and worry about, but it is definitely the first thing u see.
the worst backtests are not the one that had poor results but the ones where the profit factor is somewhere around 1,00. it means that the profits and losses are equal.
some might think that the worst backtests are simply the ones with the worsts result, but no, that is not necessarily true. at least not for me..
because when i find a strategy that is really poor and loses 9 times out of 10 entries, i can simply change the direction for each entry and... voila, i got a pretty good scoring one.
today i run a backtest that returned really horrible results. i mean, i have never run a test that would be as bad as this one.
it has 0.23 profit factor which means that from each 5 entries, 4 of them go to sl..
i tested only 40 days, but the number of trades is 505 which is quite high.. so yeah, it might say something..

reverse the position and run it on a longer frame..
maybe, this piece of crap will become one of the most profitable strategies in the entire freaking universe :-)
who knows..
5/30/2018
short nq, short ym.. and again..
two trades right after the open.
the first one was here as a speculation for a breakdown. the entry was quite aggressive and the risk of the trade was not properly calculated before triggering.
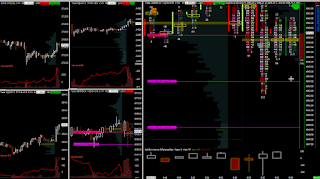
i assumed the price would slide down really quickly, but it did not happen. it wen up so here i closed the trade in a loss of cca 250 usd
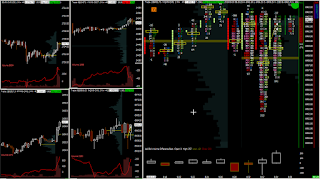
good point on this trade was that i jump out really quickly, without any hesitation. these are situations that need to reverse immediately and if they dont, i get out.
another trade was one or two minutes after the first one.
here i am short at dow jones - opening 4 contracts as well as in the previous one but the last on was not filled. i assumed the price should not go above high where i would close the whole position
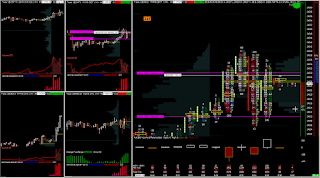
here is the exit. in fixed trade management. with only three contracts cca +250 so i zeroed out the previous loss.
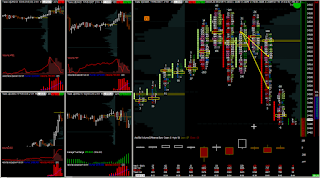
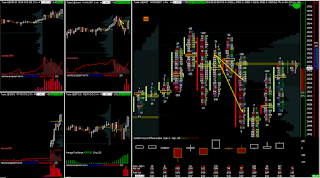
these are two examples of a very strict risk/trade management. i play any russian roulette here. i only execute, without any emotion
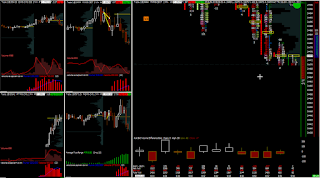
here i was ready to open aanother short at ym again, but i waited the price to tick little bit higher so that i could place my stoploss into the safe area above high easily..
the first one was here as a speculation for a breakdown. the entry was quite aggressive and the risk of the trade was not properly calculated before triggering.

i assumed the price would slide down really quickly, but it did not happen. it wen up so here i closed the trade in a loss of cca 250 usd

good point on this trade was that i jump out really quickly, without any hesitation. these are situations that need to reverse immediately and if they dont, i get out.
another trade was one or two minutes after the first one.
here i am short at dow jones - opening 4 contracts as well as in the previous one but the last on was not filled. i assumed the price should not go above high where i would close the whole position

here is the exit. in fixed trade management. with only three contracts cca +250 so i zeroed out the previous loss.

here i was ready to open aanother short at ym again, but i waited the price to tick little bit higher so that i could place my stoploss into the safe area above high easily..

yet, it did not go any higher, so the drop was without me...

5/17/2018
nq long
this was probably the best entry in this week. the boogie-woogie studies under the main chart are my acsil based subgraphs. they are amazingly strange so far, like spoiled kids, not doing what they are supposed to do ..
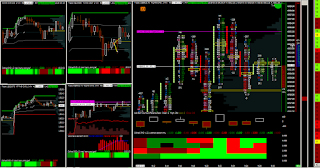


ex-it

pretty freaking sweet..
+ 450 usd/one trade
Subscribe to:
Posts (Atom)