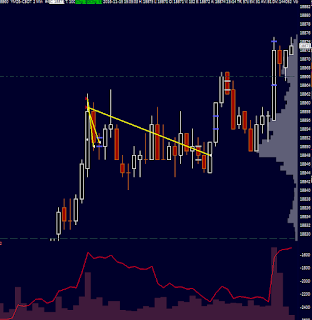
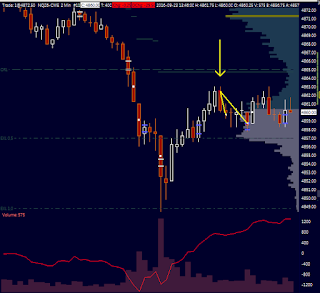
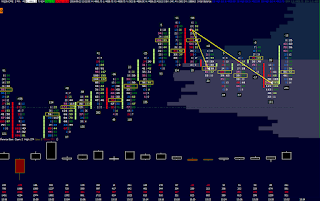
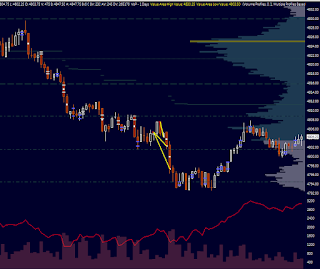
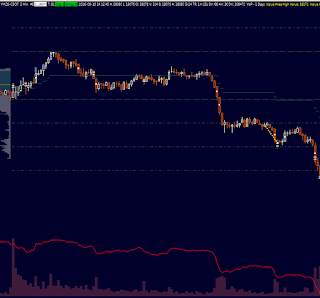
the first target is nicely placed in the thickened price action
live intraday trading e-mini futures based on orderflow (tapereading), volume and intermarket analysis
12/28/2016
market orders extinction
a nice example of timing entry with market orders study. with every new high, the market orders diminish
12/19/2016
iceberg order at 4936,50
a clever iceberg order appeared today on e-mini nasdaq futures, buying huge sell market orders at the precise price 4936,50.
it was in an intermarket unballanced state so the seller´s side here was definitely the "more stupid" one and the buy market´s side was the "clever one"
this is the detailed orderflow footprint chart
here is the intermarket situation with seller´s side to be tempted into it
it was in an intermarket unballanced state so the seller´s side here was definitely the "more stupid" one and the buy market´s side was the "clever one"
this is the detailed orderflow footprint chart
here is the intermarket situation with seller´s side to be tempted into it
this is how the price continued to run upwards for the stoplosess
12/18/2016
nq long
a second entry with timing based on the extinction of sellers. the potencial was nice
closed safely before a possible breakout
12/07/2016
orderflow mirroring
experimenting with a new sierra chart studie from www.intraday.cz aka www.order-flow.cz. here i took one trade based on the idea of mirorring orderflow. bigger buy limits are matched with bigger sell market. just one contract to test it..
here is how it went. similar situation appeared 20 minutes after
here is how it went. similar situation appeared 20 minutes after
the orderflow situation 20 minutes after
video of this peculiar trade is here
12/02/2016
intermarket liquidity pullback
this was an example of intermarket liquidity pullback against predicable buyers.
this is the entry moment, there is a nice potential for the first target here. that was a very strong reason why i took this trade. the intermarket liquidity is not so observable, but it is predictable here - and on the footprint charts the volume is really strong - dow jones futures is higher, e-mini mid cap is higher as well, s&p futures almost the same..
at first, the plan was to trail the third target little bit lower,, the buyers´s pressure was still observable..
the result 150 usd
11/29/2016
mirroring of intraday price action
an entry into a falling market - not reversal. this is that kind of entries that i dont perform often a are not easily repeatable for me, thus they are more risky. it was supported by wmo, (a new sierra chart study that i use)
here is how the trade looks at alternative timeframe (revezal 8 ticks). from this it is easily recognizable that this is a very peculiar trade for me, since normaly i go against the movement - this time i went with it
the revezal timeframe exposes one important thing - the mirroring of intraday price action
result 250 usd
11/23/2016
illusion of a falling market
this is an example of creating an illusion that the dow jones (ym) market literally is going to drop. i am going against as soon as i see the sellers diminished
unfortunately i was filled with only part position - 1 contract instead of 3. so i close it in the size of the regular rotation. the market moved up as expected (without me). if i opened the full position as intended, i would close the third one somewhere near the breakout of the daily high.
unfortunately i was filled with only part position - 1 contract instead of 3. so i close it in the size of the regular rotation. the market moved up as expected (without me). if i opened the full position as intended, i would close the third one somewhere near the breakout of the daily high.
before than i took a loss of 200 usd on nasdaq futures. i consider it to be that kind of a loss which is objective. it belongs to that system.
this was my entry price, speculation on the intermarket buyer´s liquidity to be used for lowering the nq futures price. it didnt happen, so i took a loss, but is a loss which is easy to accept as it is a part of the system
11/19/2016
short into a trend
on friday, 18th of november, i took this nice short into a falling trend on e-mini nasdaq futures in intermarket state.
after that, the price died.
the same situation for a short entry appread 20 minutes earlier at 9:06, but i was not able to catch it as it did not fit into the risk
before that there was a small loss at e-mini ym, so the result is ....
11/16/2016
liquidity abuse in nonvolatile markets
the markets were terribly nonvolatile today.
as usual, i could not trade the open, because of some other work, so i open the charts at around lunch time and ... yeah, terrible volatility.
these are the times when a market maker operates the most and moves the price against predictible traders.
i took this long on dow jones (ym) when it was observable there is a strong temptation for predictible sellers to sell the intermarket divergence.
on times and sales it is visibly observable the buy limit orders are eating bigger sell market orders - that supports the idea the market makers is going to move the price against the selling public.
this is where i opened the long position, the rrr was not perfectly fitting because of the perverted volatility, but i believed there is going to be a breakout higher soon. at the end, i had to close the fist targets nearer to the entry price.
as i said. i dont like these slow, sluggish, nonvolatile days so i tend o get out of the trade early with smaller profit. (my mistake). i didnt wanna waste time with this market, but the situation was still valid and i would not wonder if the price tested daily high
here it is still valid when it comes to orderflow -see the imes and sales still being red, no rapid change in market auction
premature exit
$ results
11/15/2016
catching the high
just one trade to mention today..
there was a nice gradation at the highest high of dow jones - the entry moment is not perfectly clear as there was a huge sell market order, (visible on times and sales) but anyway, the volume distribution on footprint was promising and the orderflow pattern was readable enough
promising market profile
closing the deal asi there is visible pressure on lower side of the consolidation
today´s result
11/14/2016
days after trump´s election
couple of days after the election of mr. trump for the president of the usa the markets are visibly nervous and with shaking liquidity.
price jumps over several levels which makes timing entry much more difficult. i took these two trades on e-mini nasdaq
first. this is an intermarket liquidity breakout nq long situation
second. an intermarket liquidity breakout nq short
siera chart tradelog
price jumps over several levels which makes timing entry much more difficult. i took these two trades on e-mini nasdaq
first. this is an intermarket liquidity breakout nq long situation
second. an intermarket liquidity breakout nq short
this is what drives me crazy - when i close the deal, the price drops for 10 points
this doesnt seem like so but it is 250 usd profit
9/23/2016
just one short
friday´s session was calm, peaceful and with readable market auction. i took just one trade on e-mini nasdaq futures. this is how it looks on intraday two minutes timeframe chart - the timing entry was based on tape reader where it was observable that buyers are no longer interested in buying for current - higher - prices.
at first, i speculated on longer movement into the short side, mostly because of the huge positive delta. at the end i decided to close that deal when a volume cluster appeared - change of liquidity might precede the change of price. and yes, it did - look at the orderflow chart
130 usd profit
9/21/2016
e-mini nasdaq intermarket liquidity short: video
this was (almost) perfect..
this is how the intraday chart of e-mini nasdaq futures looked like before today´s fomc/fed
this is how the intraday chart of e-mini nasdaq futures looked like before today´s fomc/fed
result 330 usd
9/19/2016
-230 usd loss
today it was a loss 230 usd on e-mini dow jones
more agressive timing entryin the center of the consolidation. the potential was nice,
today´s market auction was complicated to read
9/15/2016
9/13/2016
tick nyse, tick nasdaq - how they behave in volatile markets
in my trading approach i use sentiment indicators - namely tick nyse and (for trading e-mini nasdaq) also tick nasdaq. these two are basically very important indicators to me, when it comes both to the reading market context, and timing entries.
we can for example observe that within days with high volatility (today and yesterday) tick nyse and tick nasdaq tend move more into their extremes and stay there for longer period of time
tick nyse (1 minute timeframe) - you can see it goes to extremes very often - up to 1200!! normally it stays within the red lines
tick nasdaq (1 minute timeframe) has different limits for extremes but normaly it is very rare that it moves up to +400 or -400
finally, the intraday chart of e-mini nasdaq (2 minutes timeframe) shows the market was not really trending and thus tick nyse and nasdaq should stay within red lines - but due to higher volatility - it goes into extremes very very often..
(the arrow is my short entry - very small one as i wanted to close at least small profit very quickly)
today i had the charts open just for 15 minutes really. took just one trade. - the trade management could be (and should be) much better but still, 135 usd within a minute is fine.
Subscribe to:
Posts (Atom)


