9/23/2016

just one short

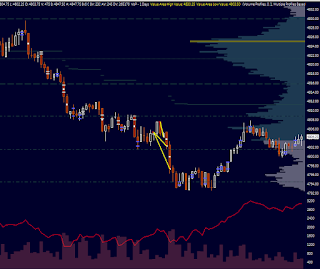
friday´s session was calm, peaceful and with readable market auction. i took just one trade on e-mini nasdaq futures. this is how it looks on intraday two minutes timeframe chart - the timing entry was based on tape reader where it was observable that buyers are no longer interested in buying for current  - higher - prices.
intraday chart of e-mini nasdaq futures
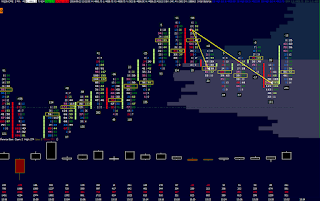
at first, i speculated on longer movement into the short side, mostly because of the huge positive delta. at the end i decided to close that deal when a volume cluster appeared - change of liquidity might precede the change of price. and yes, it did - look at the orderflow chart
orderflow chart of e-mini nasdaq futures nq
130 usd profit
table with result from intraday trading


9/21/2016

e-mini nasdaq intermarket liquidity short: video

this was (almost) perfect..

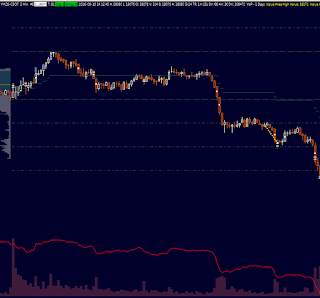
this is how the intraday chart of e-mini nasdaq futures looked like before today´s fomc/fed
intraday chart e-mini nasdaq intermarket liquidity short
result 330 usd
intraday trading result at futures nasdaq

9/19/2016

-230 usd loss

today it was a loss 230 usd on e-mini dow jones
e-mini dow jones chart
more agressive timing entryin the center of the consolidation. the potential was nice, 
e-mini dow jones long entry
today´s market auction was complicated to read

9/13/2016

tick nyse, tick nasdaq - how they behave in volatile markets

in my trading approach i use sentiment indicators - namely tick nyse and (for trading e-mini nasdaq) also tick nasdaq. these two are basically very important indicators to me, when it comes both to the reading market context, and timing entries.

we can for example observe that within days with high volatility (today and yesterday) tick nyse and tick nasdaq tend move more into their extremes and stay there for longer period of time

tick nyse (1 minute timeframe) - you can see it goes to extremes very often - up to 1200!! normally it stays within the red lines
intraday chart of tick nyse 1 minute timeframe
tick nasdaq (1 minute timeframe) has different limits for extremes but normaly it is very rare that it moves up to +400 or -400
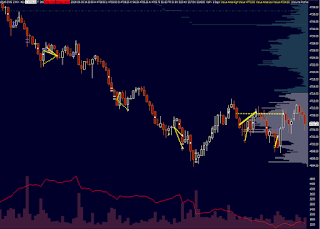
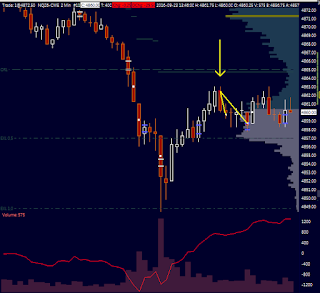
finally, the intraday chart of e-mini nasdaq (2 minutes timeframe) shows the market was not really trending and thus tick nyse and nasdaq should stay within red lines - but due to higher volatility - it goes into extremes very very often..

(the arrow is my short entry - very small one as i wanted to close at least small profit very quickly)
intraday chart of e-mini nasdaq
today i had the charts open just for 15 minutes really. took just one trade. - the trade management could be (and should be) much better but still, 135 usd within a minute is fine.
intraday trading result of e-mini nasdaq


9/09/2016

trading in a volatile market

trading in a volatile markets is always better than trading in a nonvolitile ones. today´s session was pretty goog one when it comes to volatility, the markets were in a downtrend and one might have made a lot.

the dramatic change in the volatility compared to the previous day might have been due to the ecb meeting that took place on thursday or other things (disappointing apple iphone 7, hah..). whatever it was, it caused market to fall and especially at e-mini nasdaq futures (nq) it was easily observable there was some big money secretly building huge short positions - mostly at the beginning of the session.

the market auction showed prevailing nervousness - the price jumped through many levels within a second when a market order was put into the place, quoting limit orders on depth of market were moving out, the liquidity on the first-price-touch was lowered - these are all symptoms of changed environment and one needs to count with it.

i started my trading later - these days i don´t have time to trade the open - and my priority was definitely to jump short. couple of times, it happened that the market did not fill my limits because the liquidity was weakened..

at the end of the day, i took couple of trades on the long side because i noticed the sentiment of the market changed

e-mini nasdaq futures intraday trading result

e-mini nasdaq futures trading - table of result

9/08/2016

orderflow pattern in a consolidating market

this is an example of an ordeflow pattern in a slow consolidating market, to make it clear:
  • there is a high volume cluster with lots of buyers at 13:48
  • after that the price consolidates
  • and there is a breakout of the consolidation with low volume at 13:58 - that is the entry moment
of course there must be some other attributes that fits into the trade, but it is basically how this pattern looks like

e-mini dow jones orderflow entry pattern
and yes, the market dropped, but i was unable to take any profit on that ...
e-mini dow jones intraday trading result

9/01/2016

one good trade

today i started with a loss (-300 usd) but ended up with profit (+700 usd)

here is why..
intraday chart of e-mini nasdaq (nq) trading
i scale into that position and added more contracts into the trend in every possible correction. at mid i thrown my last one (runner).  but i was quite sure the market is gonna move higher.

here is why i was quite sure i was on the right side of the market
e-mini futures markets higher timeframe
result
live intraday trading result