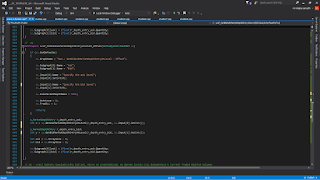
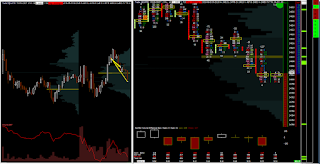
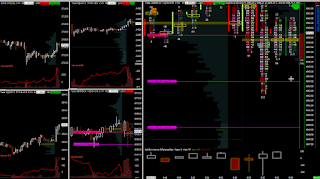
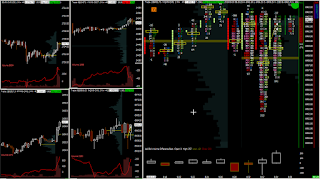
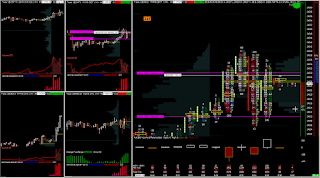
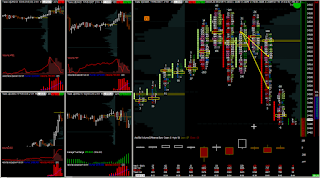
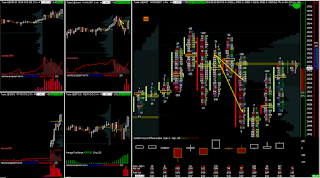
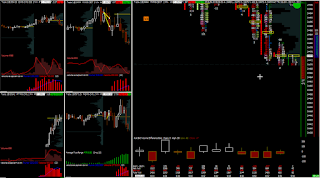
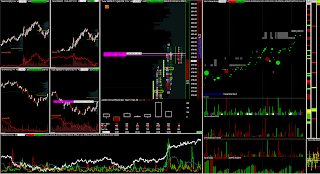
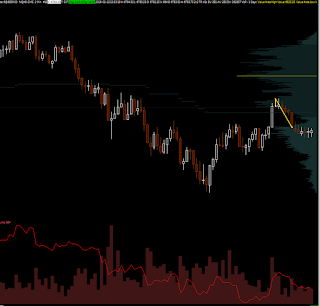
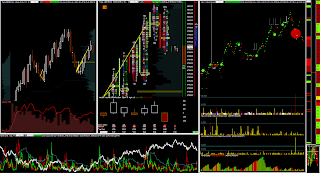
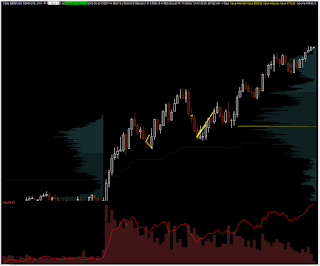
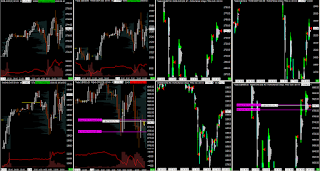
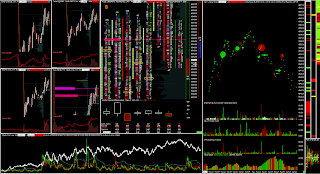
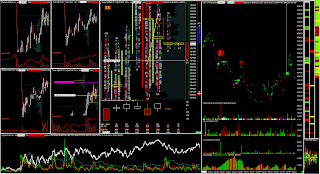
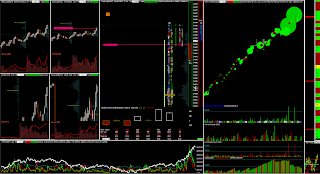
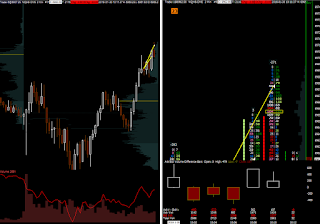
this is full code for getting POC (maximum volume) of a bar from a given timeframe. might be good to test the reaction of price to the previous day for instance..
#include "sierrachart.h"
#include <vector>
SCSFExport scsf_POC(SCStudyInterfaceRef sc)
{
if (sc.SetDefaults)
{
sc.GraphName = "Identifying POC Values";
sc.GraphRegion = 0;
sc.Subgraph[0].Name = "POC Value";
sc.Subgraph[1].Name = "POC Price";
sc.MaintainVolumeAtPriceData = 1;
sc.AutoLoop = 1;
sc.FreeDLL = 1;
return;
}
int poc_value = 0;
float poc_price = 0;
std::vector<int> v_poc_values = {};
std::vector<float> v_poc_prices = {};
const s_VolumeAtPriceV2 *p_volume_at_price = NULL;
int number_of_levels = sc.VolumeAtPriceForBars->GetSizeAtBarIndex(sc.Index);
for (int i = 0; i < number_of_levels; i++)
{
if (!sc.VolumeAtPriceForBars->GetVAPElementAtIndex(sc.Index, i, &p_volume_at_price))
break;
int last_volume_value = p_volume_at_price->Volume;
if (last_volume_value > poc_value)
{
poc_value = last_volume_value;
poc_price = p_volume_at_price->PriceInTicks * sc.TickSize;
v_poc_values.push_back(poc_value);
v_poc_prices.push_back(poc_price);
}
}
sc.Subgraph[0][sc.Index] = (float)poc_value;
sc.Subgraph[1][sc.Index] = (float)poc_price;
//log
SCString log_prices;
SCString log_values;
if (v_poc_prices.size() != v_poc_values.size())
return;
for (int i = 0; i < v_poc_prices.size(); i++)
{
log_prices.Format("%f", v_poc_prices.at(i));
log_values.Format("%d", v_poc_values.at(i));
}
sc.AddMessageToTradeServiceLog(log_prices, 0);
sc.AddMessageToTradeServiceLog(log_values, 1);
}
live intraday trading e-mini futures based on orderflow (tapereading), volume and intermarket analysis
8/23/2018
8/11/2018
ACSIL function for getting a market depth level value
simple, yet pretty useful function for getting values from particular levels at the depth of market
the good thing about this study is that you don't need to use historical market depth data on the chart, which makes it faster.
the line under the chart shows the (historical) value of bid and ask at the first level for each timestamp (here set to one second).
this can serve as a building block for creating a study for timing entry based on the quoting limit side. something i plan to do..
the good thing about this study is that you don't need to use historical market depth data on the chart, which makes it faster.
the line under the chart shows the (historical) value of bid and ask at the first level for each timestamp (here set to one second).
6/28/2018
numbers that matters
there is a holy grail hidden in these numbers
number of trades bid vs number of trades ask vs bid volume vs ask volume etc..
this is what i am currently algo testing on sp500, dow, nasdaq, rty, crudeoil, heating oil, gold, silver, copper, 6a, 6b, 6c, and all other bunch of future markets
simple, easy, clean and fast
number of trades bid vs number of trades ask vs bid volume vs ask volume etc..
this is what i am currently algo testing on sp500, dow, nasdaq, rty, crudeoil, heating oil, gold, silver, copper, 6a, 6b, 6c, and all other bunch of future markets
simple, easy, clean and fast
6/05/2018
ym should fall down
today the open was really weak with low volatiltiy and tedious price action. i had to wait 1/2 hour for the first trade that i took right here.
form the dislocation of the markets i can assume that ym should move down, the orderflow is not the best but is quite allright. opening 4 contracts.
it took a little drawdown but the price slided as expected..
here i have 3 contracts from 4 cloesd and the trade is risk free
.
form the dislocation of the markets i can assume that ym should move down, the orderflow is not the best but is quite allright. opening 4 contracts.
it took a little drawdown but the price slided as expected..
here i have 3 contracts from 4 cloesd and the trade is risk free
.
the final contract is closed after the seller´s emotion
it was the one and only trade becaus the price action was really slow.
6/03/2018
super-bad backtest results from a super simple acsil code
i have been doing some acsil coding sierra chart lately and built up a couple of new setups.
sometimes it is quite time-consuming and difficult to build a good strategy that returns nice results.
of course, backtest are not the only thing to weight and worry about, but it is definitely the first thing u see.
the worst backtests are not the one that had poor results but the ones where the profit factor is somewhere around 1,00. it means that the profits and losses are equal.
some might think that the worst backtests are simply the ones with the worsts result, but no, that is not necessarily true. at least not for me..
because when i find a strategy that is really poor and loses 9 times out of 10 entries, i can simply change the direction for each entry and... voila, i got a pretty good scoring one.
today i run a backtest that returned really horrible results. i mean, i have never run a test that would be as bad as this one.
it has 0.23 profit factor which means that from each 5 entries, 4 of them go to sl..
i tested only 40 days, but the number of trades is 505 which is quite high.. so yeah, it might say something..
next step?
reverse the position and run it on a longer frame..
maybe, this piece of crap will become one of the most profitable strategies in the entire freaking universe :-)
who knows..
5/30/2018
short nq, short ym.. and again..
two trades right after the open.
the first one was here as a speculation for a breakdown. the entry was quite aggressive and the risk of the trade was not properly calculated before triggering.
i assumed the price would slide down really quickly, but it did not happen. it wen up so here i closed the trade in a loss of cca 250 usd
good point on this trade was that i jump out really quickly, without any hesitation. these are situations that need to reverse immediately and if they dont, i get out.
another trade was one or two minutes after the first one.
here i am short at dow jones - opening 4 contracts as well as in the previous one but the last on was not filled. i assumed the price should not go above high where i would close the whole position
here is the exit. in fixed trade management. with only three contracts cca +250 so i zeroed out the previous loss.
these are two examples of a very strict risk/trade management. i play any russian roulette here. i only execute, without any emotion
here i was ready to open aanother short at ym again, but i waited the price to tick little bit higher so that i could place my stoploss into the safe area above high easily..
the first one was here as a speculation for a breakdown. the entry was quite aggressive and the risk of the trade was not properly calculated before triggering.
i assumed the price would slide down really quickly, but it did not happen. it wen up so here i closed the trade in a loss of cca 250 usd
good point on this trade was that i jump out really quickly, without any hesitation. these are situations that need to reverse immediately and if they dont, i get out.
another trade was one or two minutes after the first one.
here i am short at dow jones - opening 4 contracts as well as in the previous one but the last on was not filled. i assumed the price should not go above high where i would close the whole position
here is the exit. in fixed trade management. with only three contracts cca +250 so i zeroed out the previous loss.
here i was ready to open aanother short at ym again, but i waited the price to tick little bit higher so that i could place my stoploss into the safe area above high easily..
yet, it did not go any higher, so the drop was without me...
5/17/2018
nq long
this was probably the best entry in this week. the boogie-woogie studies under the main chart are my acsil based subgraphs. they are amazingly strange so far, like spoiled kids, not doing what they are supposed to do ..
ex-it
pretty freaking sweet..
+ 450 usd/one trade
5/12/2018
sierra chart acsil: couple of tips for adressing data from other charts
when it comes to acsil programming, sometimes you can get stuck in one place for a long time just because a simple tiny detail that you cannot solve out.
for me it was problems connected with setting up the size of arrays in overlaid charts. in sierra chart´s acsil libraries there are couple of functions for addressing the values of a different chart, but now matter which way i tried, it never worked out well.
i was able to transfer the data from other charts into my primary chart, but the values at a particular index were incorrect.
the reason was that the number of indexes in the arrays from other charts was not the same as the number of indexes in the primary one.
it sounds simple, and sierra chart support describes it in their documentation, but because i am a complete computer idiot, i was unable to get it done.
now i have finally fixed it so here i will give a couple of tips on how to do it.
first of all, a brief introduction.
why do we need to get the values of another chart, anyway?
simple example.
lets say u have found a trend pattern, but you want to open a trade only when tick nyse is above zero. for this, you need to get THE CORRECT value of tick nyse at the time (meaning at the current index) of the planned entry.
if tick nyse at the current index will be below zero, you will filter out the signal and no position will be opened, if it will be above, you will open. easy enough.
the problem is that the tick nyse starts at 8:30 and ends at 15:00
us indexes (YM, NQ, ES..) starts at 8:30 and ends at 15:15
for me it was problems connected with setting up the size of arrays in overlaid charts. in sierra chart´s acsil libraries there are couple of functions for addressing the values of a different chart, but now matter which way i tried, it never worked out well.
i was able to transfer the data from other charts into my primary chart, but the values at a particular index were incorrect.
the reason was that the number of indexes in the arrays from other charts was not the same as the number of indexes in the primary one.
it sounds simple, and sierra chart support describes it in their documentation, but because i am a complete computer idiot, i was unable to get it done.
now i have finally fixed it so here i will give a couple of tips on how to do it.
first of all, a brief introduction.
why do we need to get the values of another chart, anyway?
simple example.
lets say u have found a trend pattern, but you want to open a trade only when tick nyse is above zero. for this, you need to get THE CORRECT value of tick nyse at the time (meaning at the current index) of the planned entry.
if tick nyse at the current index will be below zero, you will filter out the signal and no position will be opened, if it will be above, you will open. easy enough.
the problem is that the tick nyse starts at 8:30 and ends at 15:00
thus it is obvious the number of indexes (the number of candlesticks) is different. and that is a big problem. if you wanna transfer the arrays (for example highs and lows) of tick nyse into the es chart and get the values for a particular candlestick at es, the values will be incorrect.
how to solve it?
easily
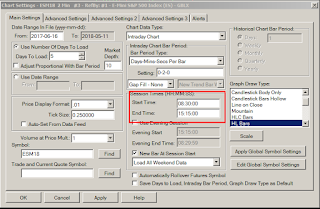
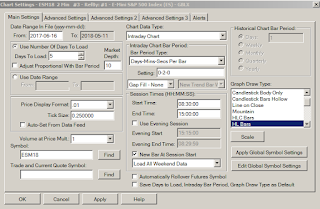
the first thing you should do in such a case is to re-set up the trading hours. normally i have trading hours in my charts like this because US indexes end at 15:15
you have to set the trading hours according to the chart that has less number of candlesticks (in this case it is tick nyse). so it should finish at 15:00
after that, it is important to set the linking with all the other charts (if u have any) so that you are sure the number of indexes will be the same for each array of each chart.
this is super important if you work with more charts that just two (just like me) and want to address the values of their arrays for computing correlations (just like me)
so this is the basic setting for working with an array of any other chart in the same chartbook. this should be used as defaults, otherwise, the values will never be correct.
after that, you have to choose which way to address the values of other charts.
i use acsil´s graphdata object which is implemented in sierra chart and works pretty fine, but there are a couple of other ways to do it (for example using overlay study and addressing the values of the overlaid chart as a subgraph).
i use acsil´s graphdata object which is implemented in sierra chart and works pretty fine, but there are a couple of other ways to do it (for example using overlay study and addressing the values of the overlaid chart as a subgraph).
anyhow, the code for getting high, low, close arrays from three different charts can look like this:
this is i would say the kernel for whatever you need when it comes to getting correct values from a particular chart. the code is pretty easy and simple, and the values that you get can be used in the same way as the values of the primary chart (eg. sc.low[sc.index], sc.high[sc.index] etc..)
pretty straightforward..
pretty straightforward..
5/11/2018
another sierra chart acsil study
i have been currently working on another acsil study which will measure intermarket divergence and filter out some trades in case the markets are too dis-correlated.
this is going to be quite a useful study which i plan to implement into all the automatic trading system. i use correlations a lot in my discretional trading and finaly i have found a way how to solve it programmatically.
this is going to be quite a useful study which i plan to implement into all the automatic trading system. i use correlations a lot in my discretional trading and finaly i have found a way how to solve it programmatically.
4/26/2018
study of velocity
this is a new, quite simple but very useful study that i wrote a couple of days ago to measure the price velocity or "volatility" if you want.
probably most of you know ATR indicator which is commonly used by all who want to track the volatility or its changes. but the problem with ATR is, that it doesn´t really show much about how the price behaved.
it only calculates the difference of highs and lows of a bar and then divides this number by a preset variable to return an average. if you have a bar which has 10 ticks in size (high-low) than the true range is 10. very simple.
but it doesn´t tell much about HOW the price behaved within the period of the ten ticks. maybe it moved 9 ticks up, then nine 9 down, then again 9 ticked up, down, up, down, up, down.. you got the idea.. within just one bar.
so at the end of the day, the price could make 100 ticks long movement which is hidden within a single bar..
this study - which i called velocity - on the other hand, calculates how many times the price changed within a period time. so u get the precise number of the volatility. or we might say "nervosity" of price.
i did not have time to test it much but it looks promising mostly as an input to automatic trade-management for algorithmic trading..
here is a simple example (subgraph 2) - you can see that even though the candlesticks are of the same size all the time, the velocity studies gradually goes down
3/18/2018
sierra chart automatic trading is cool
it works..
i have to say i am really excited about the pace i am moving forward in acsil coding, i start to like automated trading more and more every day..
currently, i have been running some tests on e-mini russell for 1000 days back with different inputs in one of my automatic trading systems written in sierra chart.
it is fascinating to me that i, as a non-programmer, can (quite easily) write a simple study, an indicator or a complex algorithm that will do all the job.
of course that so far i have written only quite an easy pieces of code, but it does not matter. they all do what i want them to do and that is what counts.
everything starts from simple and easy tasks. the more sophisticated ones will come late.
and i am sure they will come. and i am really looking forward to it.
honestly, i´m so excited that i started with c++ acsil coding.
at first it seemed quite difficult, messy, and not for me to digest. but after some time, it is manageable. it is so stimulating and it is really a great fun.
so here is the deal.
in case you are sort of hesitating if coding in acsil and sierra chart automatic trading is for you or not, this is my answer: go for it, it is amazing!!
3/07/2018
2/22/2018
hmm.. bad luck
as i said yesterday, today i planned to trade with a bigger possition of 6 contracts but was little bit unlucky, because i did not get the fill of all the 6
here i was clicking to take short, on a nice orderflow exhaustion of buyers. it was quite clear that the price does not have enough power to move so i was not hesitating..
but the price slid down really quickly and filled only 2 contracts out of 6.
first contract was closed on target within a couple of seconds to make risk free trade as usual, the other one let little bit further on a volatile target.
it was quite a nice catch of the local high with absolutely precise timing entry and virtually no drawdown
feelling really unlucky for not being filled with all the 6. it could have been a nice profit
2/21/2018
just one short
this was the only entry i did today, probably the last time with small position of two contracts only.
from tomorrow i will start with 6 again because with 2 it is like a demo version
2/20/2018
today..
nq was in a good setup for buying.
at first i tried with two contracts i but i hit only one target and the second one ended up on stoploss - very precise.. after i was stopped out, the price went up.
the second trade was a mistake, i was able to open only 1 contract so i closed it on be.
the last trade was a good one. long after the sellers' exhaustion. a good timing entry..
result 500 usd
2/17/2018
later in the evening
on friday, later in the evening, there was this situation that offered a good short setup for nq nasdaq. this is 30 minutes timeframe that i use for a long term planing if necessary.
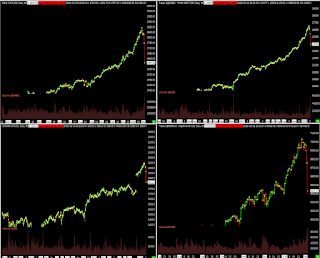
from all the four markets, only nasdaq broke the daily low, the other three did not. it creates a pressure buying, because nasdaq looks to be cheaper and dis-correlated.
i was waiting for an orderflow timing to jump into short trade and speculate against these buyers who were trapped. this is the closed trade
this was the second trade on friday. the first trade was a loss at 9:00 - i did not notice there was a report at 9:00 and took long one minute before it.
as soon as i opened the long position, the price dropped, so i had closed 200 usd loss. it was one of the quickest loss ever.
my mistake to open the trade right before the announcement report.
daily result is here.
2/14/2018
still volatile, but readable
the volatility in us indexes is still high but the market seemed a little bit more readable today. there was an intermarket scheme that i know as a good setup for long entry.
it happened in nasdaq some 15 minutes after open. i took a long trade right here. as you can see, i went into a little drawdown, because the volatility is still very high, i am not able to catch the reversal very precisely
i am opening only two contracts to eliminate the risk. i hit both the targets. the first one was closed here, making it a risk-free trade, the other was after the breaking of the daily high.
the second trade today was dow jones short after an orderflow gradation with confirmation of low heat entry.
both of the targets were closed at the level of fist one. i had a feeling that today the price will go up so taking shorts was not the most comfortable.
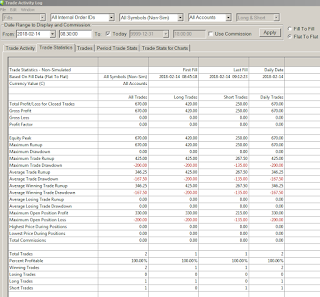
the result is 650 today is enought, i did not want expose to it any longer
2/11/2018
depth of market liquidity disappeared..
last week the indexes went into extreme volatility and i did not trade much and if so, it was kind of a testing mode..
this environment is dangerous for order flow trading because the limit side is really shaky.
when you see dom liquidity like this, you immediately have to know there is something wrong with the market.
this is something people who don´t see the market depth never realize - the change of the quoting limits.
trading in this environment is extremely dangerous, the laws that normally works and that i use for trading, does not work in this environment.
it is basically caused by market makers who are no longer interested in opening trades and thus, the short-term price action is much more unpredictable
2/05/2018
why i trade intraday
this is the reason why i trade within intraday timeframe and don´t invest long term
i can hardly remember when i saw something similar and i would NOT like be a long-term buy-and-hold investor these days.
in the markets, there applies a simple formula: the longer the timeframe, the lower the probability of guessing the correct direction
no, i don´t believe in long-term investing. it is a fake idea. all these investing gurus, buffet, hedge funds managers etc.. no one knows what is going to happen on the markets within one hour, how can they say what will happen within a week, month or a year?
short-term investing makes sense to me much more.
i am able to say what is going to happen in my life within one minute from now. much less i can say what is going to happen within one day from now, even less within one week and i have an idea what is going to happen with a year or more..
in the same way it is in the markets. i can quite accurately say what is going to happen with the price within a couple of seconds or minutes. that is all i need to do day trading.
for example today, i took one trade that lasted a couple of minutes. and by the way, it was a long trade! hah.
this was quite an easily readable long entry, due to increase volatility i took only 2 contracts. +330 usd was the result within a couple of minutes. stress-free trading
2/02/2018
it looks amazing..
yeah. the markets were falling today, the volatility was doubled compared to a normal state so that the risk and reward had to be doubled too and the opened position had to be halved.
currently, i trade smaller positions, so i opened only two contracts right here
the timing entry of this trade later in the afternoon was based on the tick-nyse indicator. the first part of the position was closed in the profit, the other part (which i meant to close quite far) ended up at stoploss.
it looks amazing, doesn´t it?
1/30/2018
one long trade after one long hour
today i took only one trade on nasdaq 100. it was long, and i had to wait for it for almost one hour.
the session started in quite a fast tempo, and i expected to get a trade signal quickly. increased volatility should offer some signals to jump in, but it was not the case today.
the market auction was not readable and i could not find a low risk entry for oppening a trade.
finaly, i found this situation.
due to increased volatility i opened only half of my normal six-contracts position, prepared to compensate up to six in case the price will move against me to the level of stoploss while still holding the edge of the entry..
unfortunately, it did not happen, the price oscillated little bit back, but not enough to add to the position.
here is the exit
i mean, this looks like a small trade in the picture of the whole intraday session, but it is +450 usd. with three contracts it is not bad.
the exit was executed according to fixed (but due to increased volatility expanded) trade management.
the session started in quite a fast tempo, and i expected to get a trade signal quickly. increased volatility should offer some signals to jump in, but it was not the case today.
the market auction was not readable and i could not find a low risk entry for oppening a trade.
finaly, i found this situation.
due to increased volatility i opened only half of my normal six-contracts position, prepared to compensate up to six in case the price will move against me to the level of stoploss while still holding the edge of the entry..
unfortunately, it did not happen, the price oscillated little bit back, but not enough to add to the position.
here is the exit
the exit was executed according to fixed (but due to increased volatility expanded) trade management.
1/29/2018
against late sellers
this trade is a model situation where i take long against late sellers.
the pattern is pretty clear - all the markets are running down, nasdaq 100 is little bit higher so the general public sees it as a "good opportunity" for selling.
but the general public is most of the time wrong.
the price retreats against them at least till the area where i can close my first target and make a risk free position..
1/24/2018
a small trade with a small position
just one long today on e-mini dow.
this one.
nothing special to say about it. except, that it was that kind of a trade that was 100% repeatable for me.
i took it with only two contracts, +180 usd. virtually zero drawdown which is a sign of a good timing entry
this one.
nothing special to say about it. except, that it was that kind of a trade that was 100% repeatable for me.
i took it with only two contracts, +180 usd. virtually zero drawdown which is a sign of a good timing entry
1/23/2018
come on man, this is going to rise!
well, these two trades are quite readable i would say, and the price went up really quickly after i clicked into them..
the timing entry at the first one is not really easy but .. what is easy in daytrading after all? we can see a sharp & emotional move downwards from the highest high.
the word "emotional" is really what makes it important because i trade against the emotional people so i really enjoy seeing something like this.
it was validated with the actual non-correlation of the markets. the entry was planed couple of minutes before it actually took place. here is the hit.
the other one was right here, after nq discovered new high and tempted high sellers to jump in. as always, i go against them, because they are too predictable.
Subscribe to:
Posts (Atom)
